Introduction
The EINP Model is a simple MARS model that incorporates georeferenced raster and vector data. The model's environment represents the Elk Island National Park in Alberta, Canada. This area is modelled as a grid layer with georeferenced cells.
We simulate the behaviour of Bison, Moose and Elk inside the park, using agents.
Our goal is to provide an initial impression of how the animal populations evolves over time to make an estimate of to total carrying capacity of Elk Island National Park.
Note: In its current state the model does not represent real animal behaviour accurately, and we hope that more features can be added in the future.
Quickstart
To use the model clone the repository by running:
git clone https://github.com/Red-Sigma/einp-model.git
Then go into the newly downloaded project and run the simulation:
cd einp-model/GeoRasterBlueprint/
dotnet run -sm config.json
If you want more details and options on how to run the simulation please have a look at Running & Output
Project Structure
After running git clone you should have a folder that looks similar to the one below.
einp-model/
├── docs/
├── GeoRasterBlueprint/
│   ├── Model/
│   ├── Resources/
│   ├── config.json
│   ├── GeoRasterBlueprint.csproj
│   ├── Program.cs
│   └── run.sh
├── GeoRasterBlueprint.sln
├── LICENSE
└── README.md
docs/: the source of red-sigma.github.io/einp-modelGeoRasterBlueprint/: contains most of the model sourceModel/: source code for layers and agentsResources/: assets like the spawn locations of the animalsconfig.json: the main configuration file that parametrizes the modelGeoRasterBlueprint.csproj: a configuration file of the .NET frameworkProgram.cs: the main entry point where the simulation startsrun.sh: a convenience bash script to run the model from a terminal
GeoRasterBlueprint.sln: a .NET solution file for use with Visual StudioLICENSE: a copy of the MIT-license under which this project is licensedREADME.md: a file describing the project
Running & Output
Installation
The MARS framework is written in C#/.NET, so you need to install the:
- .NET-SDK on your computer to develop MARS models.
- JetBrains Rider as an Integrated Development Environment (IDE). This will handle the installation of .NET for you and give an easy way to execute and debug your models. Though a license is required for using Rider, which is free for students.
Configuration & Running
The model is configured via the config.json file in the root folder of the einp-model. For more information on configuration and excecution please read MARS documentation. The execution of the simulation is defined globally (global real-time based execution).
Viewing the output
After you run the model, by hitting the Build-Taks in JetBrains Raider (small green triangle in the upper right of the IDE), the simulation will run, and produce outputs.
Visualization
Visualizing the model output
The vector data and the movement of the Bison agents is stored in a file named Bison_trips.geojson, the movement of Moose_trips.geojson and the movement of the Elk agents is stored in a file named Elk_trips.geojson.
The movement trajectories can be visualized in kepler.gl.
Below is a screenshot of the visualization output.
- TODO add screenshot
Model Structure and Resources
The following components and resources make up the model:
-
Bison: This agent type models a bison that moves around randomly in the Elk Island National Park. When its Energy is below a certain threshold, it queries the WaterLayer (see below) for a water source to navigate to. Bison agents are parameterized with the bisons.csv file in theResourcesfolder. -
Moose: This agent type models a moose that moves around randomly in the Elk Island National Park. When its Energy is below a certain threshold, it queries the WaterLayer (see below) for a water source to navigate to. Moose agents are parameterized with the moose.csv file in theResourcesfolder. -
Elk: This agent type models an elk that moves around randomly in the Elk Island National Park. When its Energy is below a certain threshold, it queries the WaterLayer (see below) for a water source to navigate to. Bison agents are parameterized with the elks.csv file in theResourcesfolder. -
Perimeter: This vector layer holds the perimeter of the Elk Island National Park. The georeferenced data are provided by theeinp_perimeter.geojsonfile in theResources/folder. -
WaterLayer: The raster layer holds a set of pixels that represent water sources in the Elk Island National Park. The georeferenced data of the water sources are provided by theeinp_water_spots.geojsonfile in theResources/folder. -
LandscapeLayer: This layer holds a grid of cells. Each cell is referenced by geo-coordinates. The georeferenced data contained in theModelfolder are used to determine which cell is accessible (i.e., within the perimeter) and inaccessible (i.e., outside the perimeter). -
VegetationLayer: This raster layer consists of a collection of pixels representing the vegetation on the surface of the park, based on the calculated NDVI. This high-resolution vegetation map was created using QGIS processing and then exported to a raster file. The georeferenced data enable agents in the simulation to effectively determine which areas in the park are suitable for food production. The associated data are located in the Resources/ folder.
Data sources
Park
General Infos and official data (click)
Animals
Bison
- Number of Bison in the park
- Sources:
- Bison Behaviour
Moose
- Number of Moose in the Park
- Sources:
- Moose Behaviour
Elk
- Number of Elk in the Park
- Sources:
- Elk Behaviour
Vegetation layer
- NDVI
- Satellite pictures: LANDSAT 8
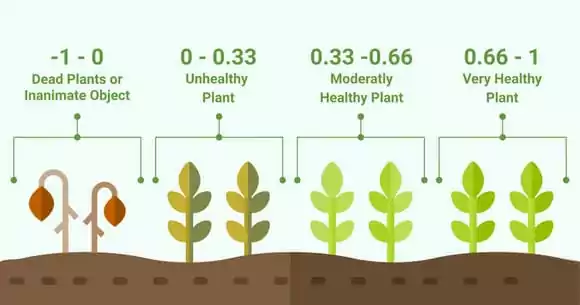
We have used Normalized Difference Vegetation Index (NDVI) for Vegetation layer, since it is a simple indicator that can be used to analyse remote sensing measurements and assess whether the target area contains live green vegetation or not. It is calculated from the visible and near-infrared light reflected by vegetation. NDVI values range from -1 to 1, with higher values indicating healthier, more dense vegetation.
The formula for NDVI is:
NDVI = (NIR - RED) \ (NIR + RED)
Where:
NIR represents the amount of near-infrared light reflected. RED represents the amount of red light reflected.
All calculations and file format conversions are made in QGIS.
Map/Geo features
Layers for our model (water layer, wood, roads etc.) were extracted from OpenStreetMap and converted in format supported by MARS. More info on feature extraction and how to query them on OpenStreet Map Wiki.
How to get additional raster data
To create a georeferenced raster layer of your simulation area, please see the MARS documentation.
Raster layers can be queried, extracted and converted with QGIS or at Geojson website.
Reference projects and papers
MARS-Group-HAW/blueprint-georaster MARS-Group-HAW/model-knp-elephant
Jennifer M., Boyce Mark S. (2022). Bison and elk spatiotemporal interactions in Elk Island National Park. (link)
Thomas Clemen, Ulfia A. Lenfers, Janus Dybulla, Sam M. Ferreira, Greg A. Kiker, Carola Martens, Simon Scheiter. (2021). A cross-scale modeling framework for decision support on elephant management in Kruger National Park, South Africa. Ecological Informatics. (link)
Bunting, Erin & Fullman, Timothy & Kiker, G. & Southworth, Jane. (2016). Utilization of the SAVANNA model to analyze future patterns of vegetation cover in Kruger National Park under changing climate. (link)
Analysis
Interim presentations
Presentations that were used to show our progress to the other people in the course.